A new study released by national nationwide consulting firm Construction Coverage shows that New York metro area mortgage payments have increased over 53% in just the last two years.
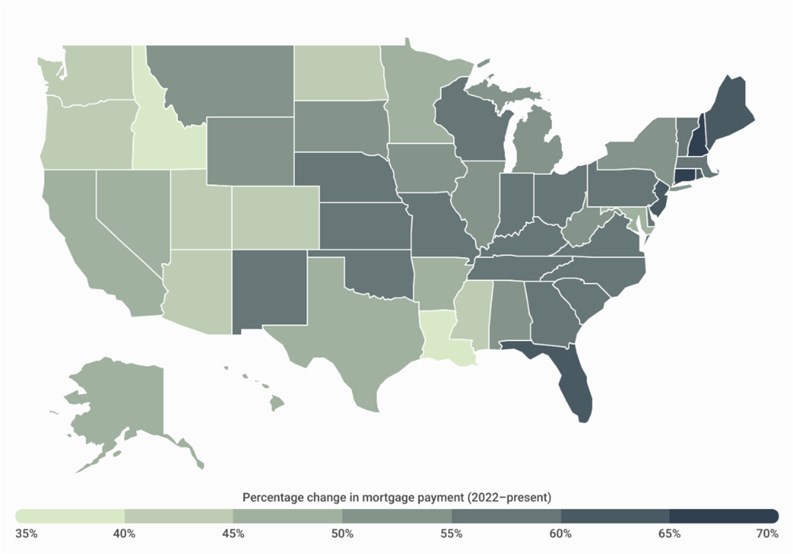
The study set out to identify the markets where homebuyers are most impacted by high interest rates. Researchers calculated the difference between the estimated monthly mortgage payment for a median-priced home in nearly 400 metros and all 50 states today compared to just two years ago.
These are the main takeaways from the study, highlighting some key stats for the New York-Newark-Jersey City, NY-NJ-PA metro area:
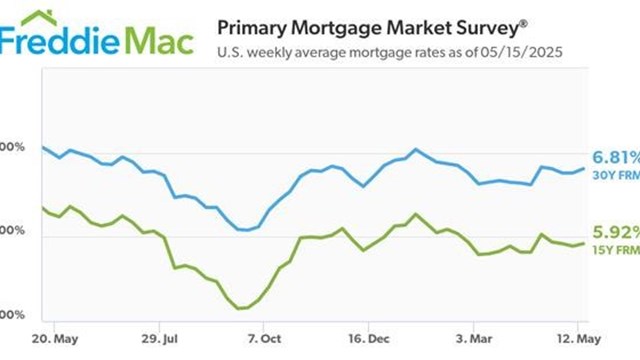
- At the national level, average mortgage rates climbed from 3.8% to 6.8% over the past two years, while median home prices rose from $316,778 to $347,716.
- Consequently, the monthly mortgage payment for a median-priced home in the U.S. is about 54% higher today than it was just two years ago—growing from $1,175 to $1,809.
- In the NY metro, the median home price climbed from $581,066 in 2022 to $634,651 today.
- Taking this median home price and the average 30-year fixed mortgage interest rate together, estimated monthly mortgage payments in the NY metro have increased by 53.1% in just two years.
- This means that NY metro homebuyers in 2022 had an estimated monthly mortgage payment of $2,156 for a median-priced home—while prospective homebuyers today would face monthly payments of $3,302 per month.
- Overall, the two-year increase in estimated mortgage payments in the NY metro lags behind the national average increase.
You can read the complete results of the analysis here, with data on nearly 400 metros and all 50 states.




Leave a Comment