
Over the past four years, home affordability in the United States has rapidly deteriorated. A combination of home price growth, increases in mortgage rates, and income gains that have failed to keep pace has made it significantly harder for Americans to enter the housing market. As borrowing power has declined and home prices continue to climb, what was once a challenge in many markets has become largely an impossibility, without some form of assistance.
A new study on behalf of financial product consulting firm Upgraded Points has identified the U.S. cities and states where saving for a home takes the longest. The analysis examines how long it would take the typical household to save for a home in cities across the country based on current home prices, mortgage rates, incomes, and other housing-related costs. Buyers are assumed to earn the median income in their area, spend no more than 30% of it on housing, and purchase a median-priced home. The down payment is calculated as the gap between the median home price and the maximum loan they can afford at today’s rates. To save that amount, they are assumed to invest 10% of their income, earning a 5% annual return.
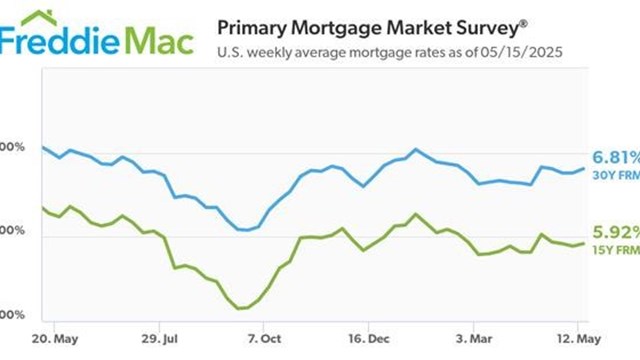
The data used in the Upgraded Points analysis came from a combination of sources: the Zillow Home Value Index (ZHVI), the U.S. Census Bureau’s 2023 American Community Survey (ACS), Freddie Mac’s Primary Mortgage Market Survey, and the U.S. Bureau of Labor Statistics Consumer Price Index. Home price and mortgage rate data are from the first quarter of 2025, while income and housing cost data come from the 2023 ACS — the most recent available — and have been inflation-adjusted to 2025 dollars.
The results reflect the growing disconnect between what homes cost and what households can realistically afford in the current market.
An Abrupt Change
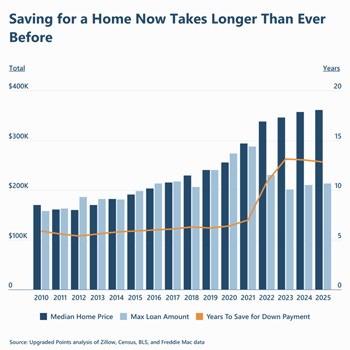
For much of the past decade, homebuyers could expect to save for a down payment in about six years. From 2010 to 2021, most buyers could afford the monthly costs of a median-priced home with a 20% down payment — a common standard that reflected how much people typically put down, even if they qualified for a larger loan.
This benchmark held relatively stable because, despite rising home prices, declining mortgage rates and steady income growth allowed buyers to borrow more. However, that changed abruptly starting in 2022. As mortgage rates spiked, the maximum loan affordable under the standard 30% housing-cost-to-income rule plummeted, even as home prices continued to rise. For the first time, the required down payment to bridge the gap between what homes cost and what people could afford exceeded 20% — reaching over 40% by 2023.
In 2025, the typical American household earning the median income of approximately $82,000 could reasonably afford a mortgage of up to $213,145. With the median home price now at $361,293, this leaves a gap of $148,148—requiring a down payment of 41%. Assuming the household saves 10% of its income and earns a 5% average return, it would take 12.8 years to save that amount—more than double the time required just a few years ago.
The Coastal Cost
Housing affordability challenges are especially acute in some of the nation’s largest coastal cities. In Los Angeles, a household earning the median income of $85,249 can afford a mortgage of just $171,809. With a median home price of $986,145, that leaves a down payment requirement of over $814,000, or 82.6% of the purchase price. At a 10% savings rate and a 5% return, it would take more than 35 years to save that amount.
In Miami, the situation is similarly difficult. A median-income household earning $62,998 can afford a $107,994 loan, which covers only a small fraction of the city's $591,524 median home price. The resulting down payment of $483,530 (82% of the purchase price) would take over 31 years to save.
San Jose, California, also ranks among the least affordable markets, requiring more than 31 years of down payment savings. Despite having some of the highest household incomes in the country ($150,166), buyers in San Jose can still only afford to borrow $407,502 of the $1.5 million median home price. This leaves a required down payment of over $1.1 million, or 73.4% of the purchase price.
In contrast to these high-cost coastal cities, several locations in the Midwest and South remain relatively affordable for the typical household. In Detroit, a median-income household would need just 3.4 years to save for a down payment. In Memphis, Tennessee, the timeline is slightly longer at 4.8 years, while in Oklahoma City, it would take about 5 years.
Across these less expensive cities, median household incomes range from approximately $42,000 to $71,000, while home prices fall between $77,000 and $202,000. Buyers in these markets still qualify for mortgages that cover most of the home’s price, so 20% down payments are attainable.
At the State Level
At the state level, long saving timelines are common in coastal and mountain states, while much of the South and Midwest remains more affordable.
Hawaii and California top the list, where the typical household would need more than 25 years to save for a home. In Hawaii, the median home price is $843,723, compared to a median income of $104,291, resulting in a 25.9-year savings timeline. In California, the median home costs $791,738, while household income stands at $102,187, requiring 25.6 years of saving.
Other high-cost states include Massachusetts (20.6 years), Montana (20.5), Washington (19.8), Oregon (19.6), and New York (19.4) — all with median home prices well above the national level. These states are concentrated along the West Coast and in the Northeast, where home values have climbed sharply in recent years.
Meanwhile, states with the shortest saving timelines are primarily in the Midwest and South. West Virginia leads at just 4.8 years, followed by Iowa (5.0) and Kansas (5.3). In these markets, home prices are around $230,000 or less, and even modest incomes can support the purchase of a median-priced home with a 20% down payment.
Here is a summary of the data for New York, NY:
- Years to save for down payment: 31.0
- Down payment necessary: $624,228
- Down payment percent: 81.3%
- Median home price: $767,759
- Max loan amount: $143,531
- Median household income: $84,556
- Max monthly housing cost: $2,114
- Max monthly mortgage payment: $939
- Non-mortgage housing costs: $1,175
For reference, here are the statistics for the entire United States:
- Years to save for down payment: 12.8
- Down payment necessary: $148,148
- Down payment percent: 41.0%
- Median home price: $361,293
- Max loan amount: $213,145
- Median household income: $82,441
- Max monthly housing cost: $2,061
- Max monthly mortgage payment: $1,394
- Non-mortgage housing costs: $667
You can read the full report and detailed methodology here.


Leave a Comment