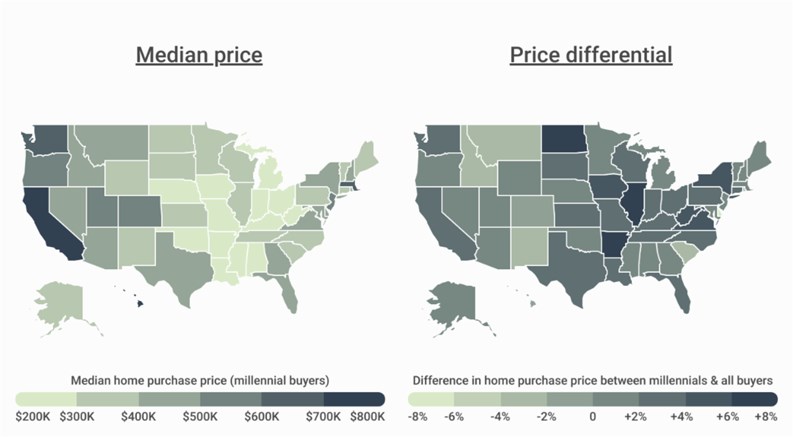
A new study from consulting firm Construction Coverage looking at the locations where millennials are buying the most expensive homes indicates that New York metro millennials are spending 1.6% more on homes than their agemates nationwide.
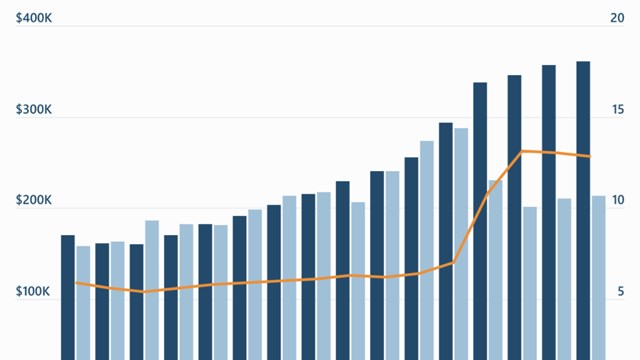
Despite the millennial homebuyer price-to-income ratio—the gap between what millennials are spending on homes versus what they make in a year— slightly easing last year, home prices increased 40.7% since 2018 while millennials’ incomes only rose 31.6%, highlighting the mounting financial barriers for the age group when it comes to homeownership. And homeownership has come at a much steeper price for millennials in some places than others.
To determine the locations where millennials are buying the most expensive homes compared to other generations, researchers compared the median price for conventional residential homes with an originated mortgage in 2023 for millennials and all other buyers, then ranked metros accordingly.
These are the key takeaways from the report, highlighting some key stats for the New York-Newark-Jersey City, NY-NJ-PA metro area:
- Millennials are entering their prime earning years: in 2023, the national median income for millennial homebuyers stood at $125,000, exceeding the $122,000 median across all buyers.
- In the NY metro specifically, millennials earned a median income of $174,000 last year.
- Nationally, the median home purchase price for millennials in 2023 was $415,000—nearly 77% higher than the median home purchase price for Gen Z buyers, and second only to the Gen X median purchase price of $445,000.
- Meanwhile, the median home purchase price for millennial buyers in the NY metro was $645,000.
- Overall, millennials in the NY metro are spending 1.6% more on their homes than what is typical across all buyers in the metro ($635,000).
- NY metro millennials are purchasing more expensive homes than average.





Leave a Comment