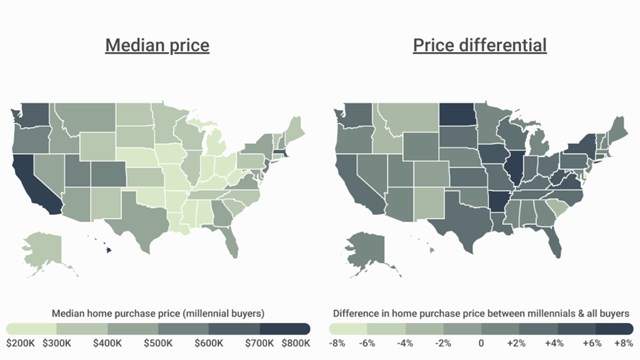
A recent analysis by Realtor.com shows that in an increasingly competitive housing market, condos, co-ops, and attached townhouses offer an affordable alternative to comparable single-family homes, especially in high-density, high-cost markets. The outlet looked at state and county-level sales data for the New York City, Boston, Chicago, and Seattle metro areas, as well as the states of New York, Massachusetts, Illinois, and Washington more broadly, which indicate that the multifamily model is currently more affordable in both central and outlying counties.
Buyers paid a nationwide average of 6.7% less for co-op, condo, and townhouse units versus comparable single-family homes in 2021, says the outlet—a statistic that understates the price difference, since multifamily home types are typically concentrated in the country’s highest-density, highest-cost areas. To wit; the analysis reveals that 84.1% of all condo/co-op/attached townhouse purchases in 2021 were in just 6% of U.S. counties.
Meanwhile, buyers are finding they have to save for longer - and stretch their budgets farther - to buy a home of any type: roughly 65% had to save up for at least a year, according to Realtor.com, and 71% exceeded the initial budget for their home purchase. With price growth of multifamily homes lagging behind that of single-families nationwide over the last decade, condos, co-ops, and townhomes may continue to provide home-seekers with a more affordable option.
City vs. Suburb
For buyers committed to urban living in a county center, purchasing a condo, co-op, or attached townhouse is a significantly cheaper option than single-family ownership. According to the analysis, in 2021 multifamily housing offered an average 33.2% discount compared to single-family homes in counties central to New York, Boston, Chicago, and Seattle.
However, that city condo or co-op is still going to be more expensive on average than an outlying single-family home—at least for now. In the states studied, the typical single-family home in a non-central county was 37.4% less expensive than the typical condo in a central county in 2021.
The continuation of pandemic-era migration out of dense urban areas to suburbs and exurbs with larger homes and more space might shrink this price difference, given that single-family homes in outlying areas are the fastest appreciating category when comparing pre-pandemic 2019 data to 2021.
Case Study: Chicagoland
In central Chicago’s Cook County, 52.4% of all sales were of the condo/co-op/townhouse variety in 2021 and averaged 10.4% below the price of comparable single-family homes in the county. By contrast, in suburban DeKalb County, multifamily homes made up only 7.2% of sales, but they came in at an average 18.2% discount versus their comparable single-family homes. The average single-family home in DeKalb County was 9.0% less expensive than a condo, co-op, or townhouse in Cook County in 2021. Between 2019 and 2021, condo/co-op/townhouse sale prices in Chicago increased by 11.2%, while single-family homes in the area increased by 19.0%.
Looking Ahead
According to the study, as of May 2022 condos, co-ops, and townhomes made up 21.4% of typical monthly listings nationwide and listed 0.5% below the asking price of comparable single-family homes—the lowest discount in May in the data’s history. Multifamily home price growth outpaced single-family home price growth at a national level in May 2021 and May 2022. The shrinking discount and faster price growth are likely due to the high concentration of multifamily housing in high-priced areas, as well as increased demand for such housing, notes Realtor.com. Active multifamily listings were down 10.5% year-over-year in May, while single-family home active listings were up 14.5% year-over-year. Realtor.com suspects that increased condo demand kept multifamily inventory low while single-family home inventory made progress towards pre-pandemic levels. The number of condo, co-op, and townhome pending listings is down year-over-year, but up 50.3% compared to 2017-2019 levels, indicating the popularity of this housing type as the market has gotten less affordable.


Leave a Comment