
According to a recent item from the National Housing Conference (NHC) in Washington, DC, home prices have surged far faster than local incomes over the past two decades.
According to the NHC, a new analysis from the Federal Reserve Bank of St. Louis emphasizes that this pattern is visible in nearly every corner of the country. The report, “When Houses Outrun Paychecks: The Lost Decades of Housing Affordability,” analyzes underlying changes in home value between 2000 and 2024, revealing that nominal prices rose about 207% nationwide, while per capita incomes increased only about 155%.
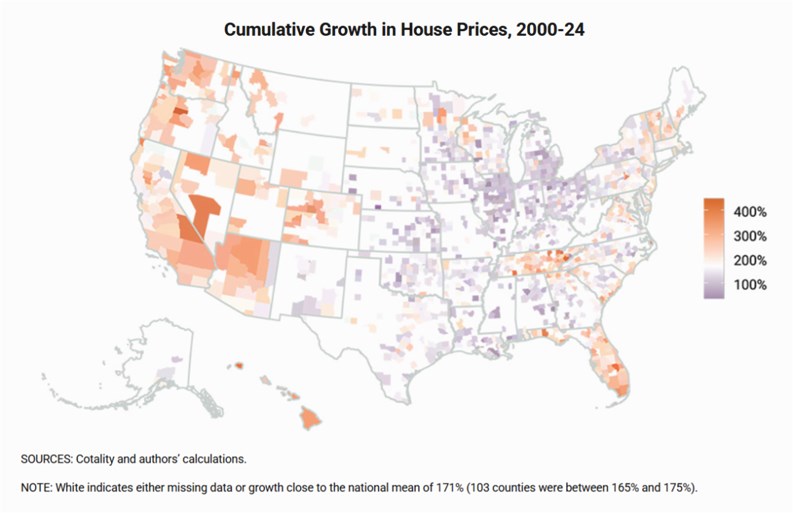
The map of cumulative house price growth shows that virtually all shaded counties experienced sizable gains, with white areas indicating either missing data or growth clustered around the national mean of roughly 171%. Cooler purple tones mark places where cumulative appreciation was relatively modest, dipping as low as about 22%, whereas progressively deeper oranges highlight extreme run-ups that exceeded 450%.
Particularly intense price growth appears across much of the West and Mountain West, large parts of Texas and Florida, and selected metros in other regions, while even many Midwestern and Southeastern counties that historically saw slower appreciation posted solid, positive gains.


Leave a Comment