
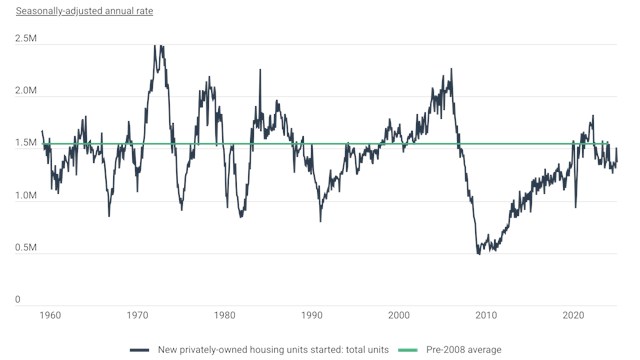
According to a new report from Construction Coverage, a website that compares construction software and insurance, the current housing shortage—which is now estimated to be between 4 million and 7 million homes—can trace its beginnings to long before the COVID-19 pandemic. In the 10 years following the Great Recession, the United States constructed fewer new homes than in any other decade since the 1960s.
Simply put, the nation has not built a sufficient number of homes to meet demand—though this lack of housing affects certain areas more severely than others. For the report, researchers ranked locations based on the percentage change in the average monthly housing inventory—the total number of active listings plus pending sales at the end of the month—between Q1 2023 and Q1 2024.
These are the key takeaways from the report, focusing on national-level data:
U.S. housing inventory decreased from more than two million in 2012 to a low of approximately 630,000 at the start of 2022.
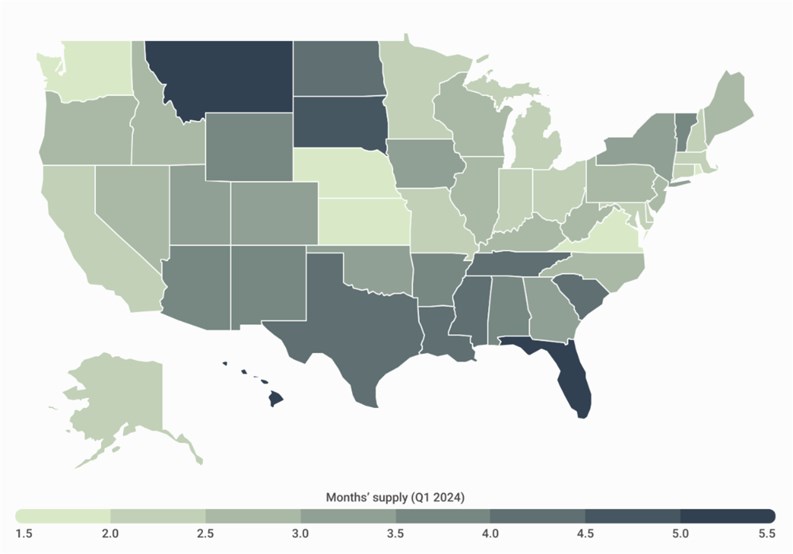
Over the same period, months’ supply—a measure of how long it would take existing inventory to sell if no new homes came on the market—plummeted from a national high of 7.5 months to a historic low of 1.1 months.
Fortunately, inventory has rebounded slightly since early 2022: throughout the first quarter of 2024, the national inventory hovered around 970,000 homes for sale, marking a 4.0% year-over-year increase.
Despite this uptick, existing inventory would sustain the current sales pace for just 2.9 months—a marginal increase from the 2.8 months’ supply recorded last year.
For the sake of comparison, here’s a look at the data for New York City:
In the first quarter of 2023, the months’ supply in NYC was 6.5 months.
As of Q1 2024, that figure is 6.4.
Over that same span, NYC experienced an 8.8% decrease in housing inventory.
You can read the report and the complete results of the analysis here, including data on more than 300 U.S. metros and all 50 states.


Leave a Comment