
According to a new study on behalf of construction industry researchers Construction Coverage, after more than two years of stiff competition and fast-rising prices, the U.S. residential housing market experienced a rapid cooldown throughout the latter half of 2022 and the early months of 2023. Subsequently, after a turbulent few years of price surges, rapid cooldowns, and fluctuating mortgage rates, the U.S. housing market is entering 2026 with a new set of dynamics.
Cooling Demand
Driven by persistently elevated mortgage rates and widespread inflation, residential real estate demand has stagnated in many parts of the country. Affordability remains a major hurdle, especially for first-time buyers contending with high borrowing costs and limited supply in the entry-level segment—challenges that have prompted some markets to focus on expanding access to more affordable housing options. As we move into the prime spring and summer selling seasons, real estate activity will be top of mind, with certain metro areas emerging as particularly hot markets due to strong job growth, demographic shifts, and continued demand for housing.
As high mortgage rates continue to challenge affordability, home sale prices are plateauing. During the COVID-19 pandemic, home values soared, with year-over-year price growth peaking at 26.3% in May 2021 before gradually slowing. By late 2022, annual growth had fallen to just 1.0%, and by April 2023, prices had declined 4.1% from the previous year. After a period of growth in 2024 and recovering to historical norms, price growth has since cooled. As of January 2026, home prices were just 1.1% higher than the year prior.
Looking at the broader trend, home price growth has been cyclical over the past decade, with sharp surges during the pandemic followed by a market cooldown. While price growth is no longer as extreme, continued demand and limited inventory have kept upward pressure on home prices. Recent data suggests that even as affordability challenges persist, home prices continue to rise, albeit at a much more sustainable rate.
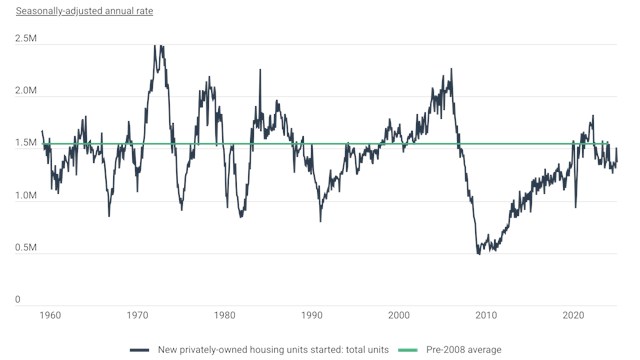
Similar to home prices, the trajectory of home sales has been a roller coaster in recent years. The COVID-19 pandemic initially brought transactions to a near standstill, with sales plummeting by more than a third from the spring of 2019 to the spring of 2020. When the market rebounded, sales surged, reaching a record 48.4% year-over-year increase in May 2021. However, as mortgage rates rose and affordability worsened, sales volume declined sharply, falling 35.1% year-over-year by December 2022.
Since early 2023, home sales have gradually recovered. Though still below pre-pandemic levels, sales were down just 7.1% year-over-year by the close of 2023, marking a significant improvement from the previous year’s steep declines. While that momentum continued into 2024, the market has since slowed. As of January 2026, home sales were down 8.3% compared to the year prior.
The View From New York
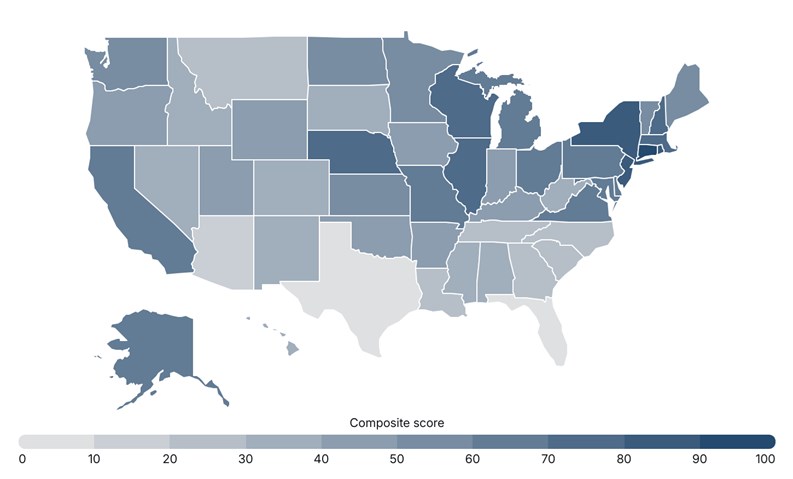
States in the Northeast dominate the rankings, with seven of the top 10 hottest states located in the Northeast. Connecticut leads the country with a composite score of 93.9, followed closely by New Jersey (89.0), Rhode Island (87.8), and New York (86.9). Despite its high cost of living, California ranks among the most active markets with a score of 62.9, and several of its northern metro areas—including San Francisco, San Jose, and Oakland—stand out as the hottest housing markets among large cities (those with populations over 350,000). One major factor driving demand in these areas is the difficulty of adding new housing supply. Densely populated cities in the Northeast and restrictive zoning laws in California have made it harder to build new homes, keeping supply tight and prices elevated.
Here is a summary of the data for New York, NY:
- Composite score: 49.4
- Median sale price (Jan 2026): $867,500
- 1-year change in median sale price (2024–2025): +5.8%
- Share of homes that sold above asking: 14.9%
- Median number of days on the market: 63.0
- Average sale-to-list percentage: 98.1%
- Share of listings with price drops: 19.1%
For reference, here are the statistics for the entire United States:
- Composite score: N/A
- Median sale price (Jan 2026): $422,921
- 1-year change in median sale price (2024–2025): +1.6%
- Share of homes that sold above asking: 27.0%
- Median number of days on the market: 48.7
- Average sale-to-list percentage: 98.8%
- Share of listings with price drops: 18.1%


Leave a Comment