
New York City is known for its hustle - after all, as the song says: if you can make it here, you can make it anywhere. But if ‘making it’ here includes owning a median-priced home, a new report by nationwide moving coordinators HireAHelper makes clear exactly what it takes to make that happen - at least in terms of hours worked per week.
The study looked at U.S. locations whose residents have to work the most hours to afford a home. Researchers ranked metros according to the weekly work hours needed to afford a median-priced home. The analysis assumes the worker is earning a median wage, makes a 20% down payment on the mortgage, and allocates less than 30% of their monthly wage to mortgage payments.
After crashing in the spring of 2020, the job market has made an astounding comeback. In mid-2022, this ratio reached a peak of 2.0, the highest it’s been in over two decades. While the job market has cooled slightly in recent months, it is still hot, and abundant job openings mean that workers have plenty of job options to consider. However, while the robust labor market has been a boon to workers looking for new job opportunities, home prices have risen dramatically, eroding increases in pay and making it difficult to afford a home in some locations.
Hard Numbers, Harder Realities
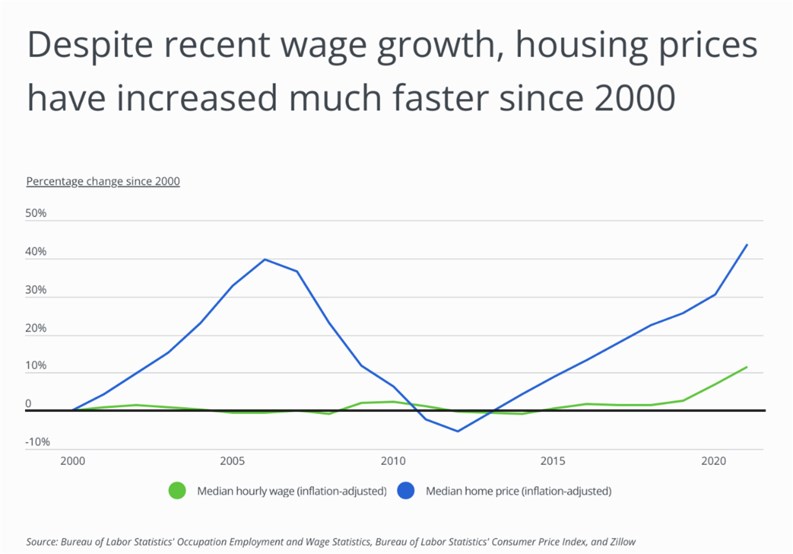
Put into hard numbers, real median hourly wages have grown by 11.4% since 2000. However, home prices have risen even faster; the real median home price has grown by nearly 44% over the same period. While workers’ wages are rising, home prices—and price levels overall—are eating away at these earnings gains. As workers consider moving to take advantage of better-paying jobs, regional differences in home prices remain top of mind.
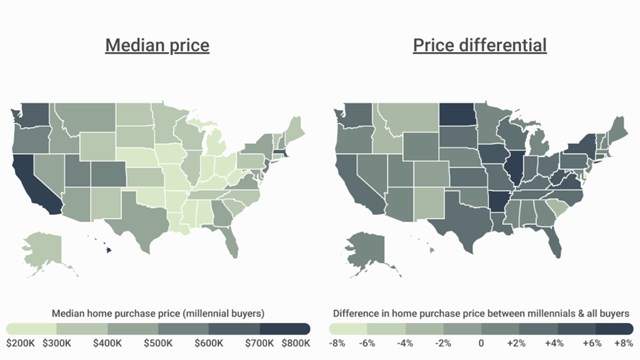
On a regional level, workers tend to earn more on the West Coast, but disproportionately high home prices mean that they must work more hours to afford a home. At the state level, the typical worker in Hawaii, California, and Utah must work over 100 hours per week to afford a median-priced home without being considered ‘cost-burdened’- meaning that the worker allocates no more than 30% of their monthly income to mortgage payments. (By contrast, a typical worker in Mississippi or West Virginia doesn't even need to work a full 40-hour week to comfortably afford a median-priced home.)
To determine the highest work-hours-for-homeownership locations, researchers at HireAHelper analyzed the latest data from the Bureau of Labor Statistics and Zillow. The analysis assumed the worker is earning a median hourly and annual wage, made a 20% down payment on the mortgage, and allocates less than 30% of their monthly wage to mortgage payments. Researchers also calculated the median home price and monthly mortgage payment for same.
The analysis found that residents of the New York City metro area need to work 88 hours a week to afford the $617,849 median home price. Here is a summary of the data for the New York-Newark-Jersey City, NY-NJ-PA metro area:
- Weekly work hours needed to afford a median-priced home: 88
- Monthly mortgage payment for a median-priced home: $3,069
- Median home price: $617,849
- Median hourly wage: $26.83
- Median annual wage: $55,810
For reference, here are the statistics for the entire United States:
- Weekly work hours needed to afford a median-priced home: 62
- Monthly mortgage payment for a median-priced home: $1,775
- Median home price: $357,319
- Median hourly wage: $22.00
- Median annual wage: $45,760


Leave a Comment