

The 2025 edition of Construction Coverage’s Cities With the Highest Home Price-to-Income Ratios report examines the cities and states where housing affordability has taken the biggest hit.
Key Takeaways
- Home Prices Far Outpace Incomes: The median household income in the U.S. has nearly doubled since 2000, climbing from about $42K to $80K. However, during that same period, the median home price has nearly tripled—jumping from $123K to $340K. After adjusting for inflation, income growth stands at just 8.5%, compared to 56% for home prices.
- California and Hawaii Remain Least Affordable States: Despite below-average growth in median home prices over the last five years, California and Hawaii are the least relatively affordable states, with price-to-income ratios of 8.2 and 8.8, respectively.
- Price Surges Have Made More States Unaffordable: Several Mountain West and Western states now rank among the most unaffordable in the country. Montana and Idaho have become significantly less affordable due to rapid home price growth—more than 56%—since 2020, pushing their price-to-income ratios above 6.0.
- Housing Affordability in New York City: Since 2020, the median home price in New York City has jumped 7.7%. It now sits at $763,358, while the median household income is $76,577. With a home price-to-income ratio of 10.0, New York City is the 5th least affordable large city in the country.
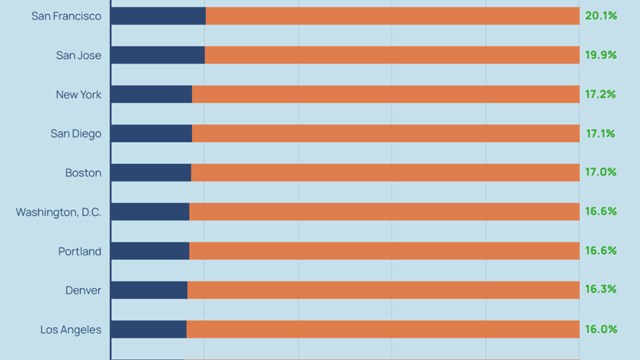
The full report covers over 350 U.S. cities and all 50 states, with a detailed breakdown of price-to-income ratios, home price growth, and the share of mortgage holders spending more than 30% of their income on housing in each location.


Leave a Comment