
As home prices continue to climb across the United States, housing affordability remains a critical concern for both prospective buyers and policymakers. A new study on behalf of construction industry research firm Construction Coverage has identified the U.S. cities and states where new housing is being developed most affordably.
Over the past decade, persistent price growth—driven by limited supply, strong demand, and rising construction costs—has reshaped access to homeownership nationwide. Recent data from the National Association of Realtors (NAR) shows that while inventory has improved modestly, middle-income households still face significant gaps in affordability. As of early 2025, buyers earning around $75,000 annually could afford just 21% of listings—less than half the share available to them before the pandemic.
These conditions highlight the ongoing pressure to expand the supply of affordable homes. This analysis draws on data from the U.S. Census Bureau and Zillow to examine national home price trends, builder activity, and the cities and states where new housing is being developed most affordably.
Home prices across the United States continue to rise, despite persistently high interest rates. In June 2025, the national median sale price reached a record of nearly $374,000—more than double the post-recession low of $140,000 in early 2012. For context, median earnings for full-time workers rose just 55% over that same period.
Although the pace of home price growth has slowed since the pandemic-era surge, the modest cooling has done little to help buyers. Since early 2022, the median sale price has risen by nearly $70,000, while higher mortgage rates have pushed estimated monthly payments up nearly 60% compared to three years ago—making homeownership significantly more expensive.
This combination of elevated prices, high borrowing costs, and slow wage growth has pushed homeownership further out of reach, especially for lower-income and middle-class families. A persistent shortage of starter homes continues to limit affordable options, and without a significant increase in supply, the affordability crisis is unlikely to ease.
To make matters worse for prospective buyers, residential construction activity has declined significantly over the past year. Inflation-adjusted spending on residential construction fell 8.5% between June 2024 and June 2025, according to federal estimates. This drop comes despite ongoing initiatives aimed at boosting housing supply.
The decline reflects a mix of economic and market pressures. High interest rates have raised borrowing costs for builders, making new projects more expensive to finance. At the same time, elevated labor and material costs have squeezed profit margins, while concerns about buyer affordability have made some developers more cautious about launching new projects. Much of this economic uncertainty has also spilled over into the non-residential sector, where construction spending has declined as well—though not as sharply as in the residential sector.
With fewer homes being built—especially at lower price points—the slowdown threatens to worsen the already limited supply of affordable housing, leaving many buyers with even fewer options.
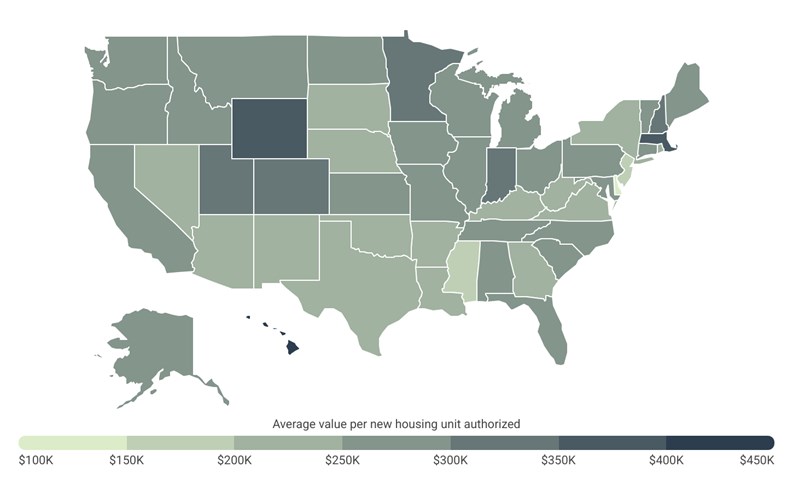
Despite high construction costs and reduced residential investment nationally, some states and cities are still managing to prioritize more affordable homes. One way to assess this is through the average construction value per new housing unit authorized—a standardized measure of how much is being invested in the physical structure of newly built homes, excluding land costs. This metric offers insight into where lower-cost construction may be supporting more attainable housing.
In 2024, the national average was $260,229, up 7.6% from 2023. However, several states fell well below that figure, including Delaware ($146,106) and New Jersey ($170,086), the two lowest in the country. Other relatively low-cost states include Mississippi ($193,868), Nebraska ($200,946), Kentucky ($209,131), and New York ($219,404). Most states prioritizing more affordable housing are located in the Southeast, Northeast, and Midwest.
Among large metropolitan areas—those with populations over 1 million—the list of locations building the most affordable new housing is equally diverse. Omaha, NE ($172,691); Richmond, VA ($180,794); and New York, NY ($182,378) reported the lowest average cost per new housing unit last year. Other major metro areas including Los Angeles, CA; Philadelphia, PA; and Austin, TX also reported average construction values below the national level.
At the other end of the spectrum, major coastal metros like Miami, FL ($391,718); San Francisco, CA ($369,681); Portland, OR ($341,810); and Boston-Cambridge ($337,227) reported some of the highest construction values per unit. These figures can reflect a combination of factors, including higher building costs, more stringent building codes, and a greater focus on high-end residential development relative to more affordable units.
Here is a summary of the data for New York-Newark-Jersey City, NY-NJ:
- Average value per new housing unit authorized: $182,378
- Total new housing units authorized: 57,929
- Total value of new housing units authorized: $10,564,952,000
- Median home price: $712,843
- Share of new units that are multi-family: 78.4%
For reference, here are the statistics for the entire United States:
- Average value per new housing unit authorized: $260,229
- Total new housing units authorized: 1,478,000
- Total value of new housing units authorized: $384,618,396,000
- Median home price: $369,147
- Share of new units that are multi-family: 33.6%
Click here to read the full report and methodology.


Leave a Comment