
Gen Z is hitting adulthood at a difficult time. Defined as those born between 1997 and 2012, most Gen Zers today are firmly in early adulthood or in their teenage years. Finding footing at this stage of life is challenging enough on its own. But Gen Z has had to navigate this formative time with the backdrop of the COVID-19 pandemic, the pandemic’s social and economic fallout, and, more recently, rising prices and the threat of a recession.
These factors could create lasting difficulties for members of Gen Z, which in turn could compound a trend in recent decades of young people delaying major life milestones like marriage, parenthood, and homeownership. Despite these challenges, some members of Gen Z are already inching towards (or enjoying) financial independence, and living on their own. A new report from Porch looks at which U.S. locations have the most Gen Z residents already living on their own. Researchers calculated the percentage of adult Gen Zers not living with a parent or grandparent in each location, then ranked metros accordingly.
These factors could create lasting difficulties for members of Gen Z, which in turn could compound a trend in recent decades of young people delaying major life milestones. Over time, young adults have increasingly prioritized educational attainment, career advancement, and financial security over other significant markers of adulthood like marriage, parenthood, and homeownership. Gen Z’s current social and economic realities could accelerate these trends.
Marriage has been one of the most prominent milestones to be delayed further into adulthood. Over the last few decades, the typical age at which people marry has increased substantially. For men, the estimated median age at first marriage in 1960 was 22.8, while women’s median age at first marriage was 20.3. Today, those figures are 30.4 and 28.6, respectively.
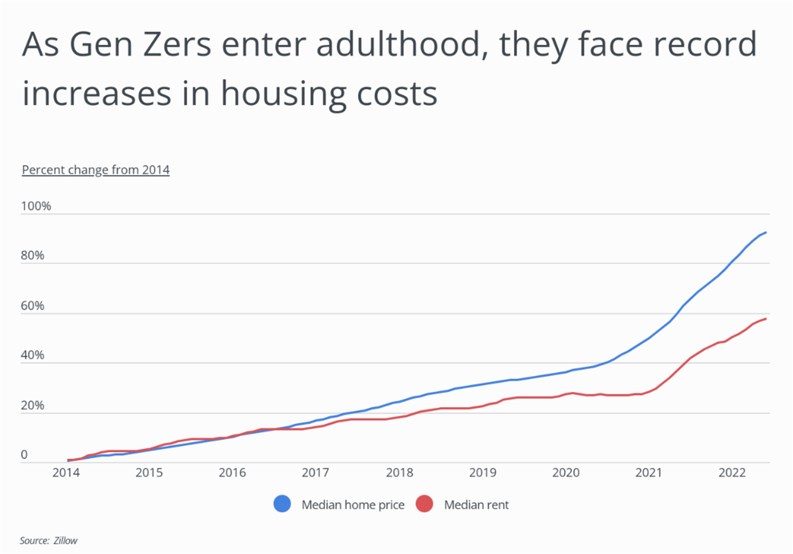
Recently, economic trends have also made it more difficult for Gen Z adults to live independently. When the COVID-19 pandemic hit in 2020, older members of Gen Z were entering early adulthood, a time when many people begin to move away from home or settle after finishing school. But lockdowns and other disruptions from COVID made it difficult to move, and beginning in late 2020, home prices and rents saw dramatic spikes across the U.S. that have made housing less affordable. Today, more Gen Zers are living at home than any generation in decades.
While housing has become more expensive, members of Gen Z also struggle with affordability because they have not yet reached their full earning potential. Gen Zers are either early in their careers or still in school, so their earnings lag behind members of other generations. The median annual wage for a full-time, adult Gen Z worker is just $24,000, less than half of what more experienced workers in Generation X or the Baby Boomer generation earn.
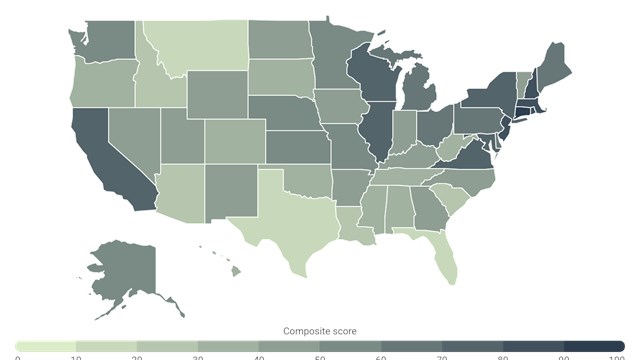
Despite these challenges, some members of Gen Z are already inching towards (or enjoying) financial independence, and living on their own. Locations in the central U.S. tend to have more affordable housing, and in these places, members of Gen Z are more likely to be living on their own—defined here as those Gen Zers not living with a parent or grandparent. Eleven states have more than 40% of adult Gen Zers living on their own, led by North Dakota (46%) and Wyoming (45.9%). In contrast, young people are less likely to live on their own in the Northeast. This includes Rhode Island and New Jersey, where less than a fifth of Gen Z adults have moved away from home.
At the metro level, most of the top locations where Gen Zers are living on their own are found in affordable parts of the country, but there are some exceptions. Expensive, but economically prosperous, cities like Austin, Seattle, and Portland also have high shares of Gen Zers living on their own, as they attract young people with jobs in tech and creative fields.
The data used in this analysis is from the U.S. Census Bureau. To determine the locations with the most Gen Z adults already living on their own, researchers at Porch calculated the percentage of adult Gen Zers not living with a parent or grandparent. For the purpose of this analysis, adult Gen Zers are defined as those between 18 and 23 in the year 2020, the most recent data available. In the event of a tie, the location with the greater total adult Gen Zers living on their own was ranked higher. To improve relevance, only metropolitan areas with at least 100,000 residents were included. Additionally, metros were grouped into cohorts based on population size: small (100,000–349,999), midsize (350,000–999,999), and large (1,000,000 or more).
The analysis found that 19.6% of Gen Z adults in the NY metro area live on their own, compared to 30.6% nationally. Out of all large U.S. metros, the NY metro has the 2nd fewest Gen Z adults already living on their own. Here is a summary of the data for the New York-Newark-Jersey City, NY-NJ-PA metro area:
- Percentage of adult Gen Zers living on their own: 19.6%
- Total adult Gen Zers living on their own: 284,645
- Total adult Gen Z population: 1,448,644
- Median annual wage of full-time adult Gen Zers living on their own: $30,000
- Median annual wage of all full-time adult Gen Zers: $27,000
For reference, here are the statistics for the entire United States:
- Percentage of adult Gen Zers living on their own: 30.6%
- Total adult Gen Zers living on their own: 8,002,126
- Total adult Gen Z population: 26,124,310
- Median annual wage of full-time adult Gen Zers living on their own: $25,500
- Median annual wage of all full-time adult Gen Zers: $24,000
For more information, a detailed methodology, and complete results, you can find the original report on Porch’s website: https://porch.com/advice/where-gen-z-is-living-on-their-own


Leave a Comment