
The COVID-19 pandemic has wreaked havoc on many segments of the real estate market in the past year. A recent article in The New York Times notes that many home markets have been very active and have seen prices increase - with the exception of New York City and San Francisco, where prices for co-op and condo apartments have adjusted downward at a serious rate. Yet, according to Eric Benaim, founder and CEO of Modern Spaces, a brokerage based in Queens, that’s not the case in Astoria.
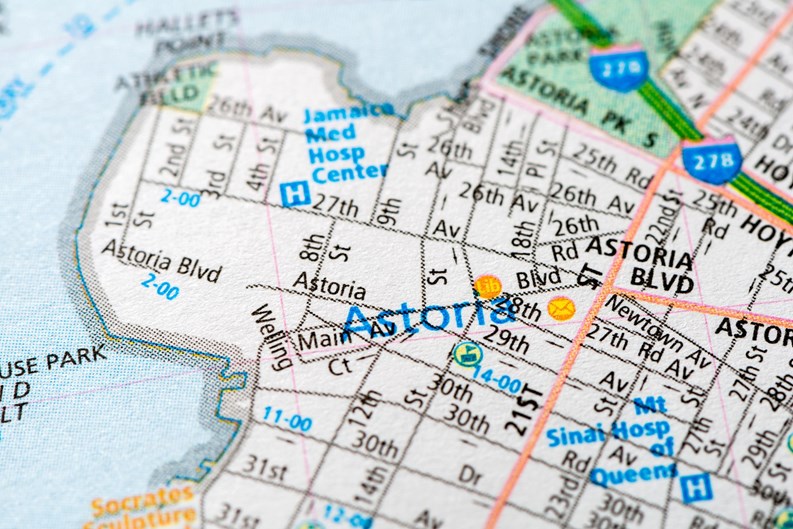
What’s Going On in Astoria?
Astoria, located in the northwest corner of Queens, has seen a level of growth during the pandemic not seen elsewhere in the New York City co-op and condo market, according to Benaim. “In fourth quarter 2019, pre-pandemic, 13 luxury condo unit sales closed in Astoria. An additional 12 luxury units went to contract in that same period,” says Benaim. The average sales price per unit for that period was $738,000, and the median price $742,000. The average price per square-foot was $845, and the median price per square foot, $925.
For third and fourth quarter 2020, in the midst of the pandemic, 24 units went to contract and 11 closed. Third quarter figures show an average sales price of $665,000 per unit and a median price of $627,000. While that demonstrates a decline in overall average prices, the average price per square-foot rose to $1,143, with a median price per square-foot of $1,149. In the fourth quarter, average sales price rose to $751,000, with median sale price remaining about the same. Average price per square-foot rose to $1,196, and median price per square-foot to $1,203. These figures tell us several things: An overall increase in price per square-foot indicates a rising market. The accompanying temporary decline in average sales price per unit may indicate that more smaller units were sold, therefore averaging smaller overall sales prices - one-bedroom vs. two-bedroom units, for instance - while at the same time higher prices per square-foot. The underlying truth though, is that Astoria has seen an increase in price - hence in value as well - unseen in other neighborhoods previously perceived as more 'desirable.’
Why is Astoria Different?
“Starting in Long Island City and now expanding into Astoria,” says Benaim, “we have seen an increase in demand for units with both shared and private outdoor spaces due to the pandemic. These properties offer that.” Benaim points to two new luxury condo buildings which launched sales in 2020, while the pandemic was in full force, as excellent examples of why Astoria’s new development has been so well received. “In addition the spacious, open layouts also featured in these properties have been rising in popularity over the last decade. Part of the reason people are choosing Astoria is for the extra space to work and exercise from home.”
Benaim also points out that Astoria offers a unique, trendy and diverse community while being in close proximity to the city via subway and automobile. “These new luxury buildings are the first of their kind in Astoria and are already showing pricing similar to Long Island City and parts of Brooklyn. This clearly indicates to us that there is demand for this type of luxury product in Astoria and the market should grow significantly over the next few years.” Perhaps, Queens’ moment has finally arrived.


Leave a Comment