Report: NYC's Housing Market Ranks 48th of 52 Largest US Cities' Wisconsin, Virginia, & NJ All Beat the Big Apple

Report: NYC's Housing Market Ranks 48th of 52 Largest US Cities'
Source: Construction Coverage analysis of Redfin data | Image Credit: Construction Coverage

According to a surprising recent report from consulting firm Construction Coverage ranking the ‘Hottest Real Estate Markets of 2024,’ the NYC metro market ranks 48th out of 52 large U.S. cities. “While 2023 marked a notably more subdued year for real estate compared to the preceding years,” the report says, “recent signs suggest market conditions could be heating up again—though some geographies are seeing more activity than others.”

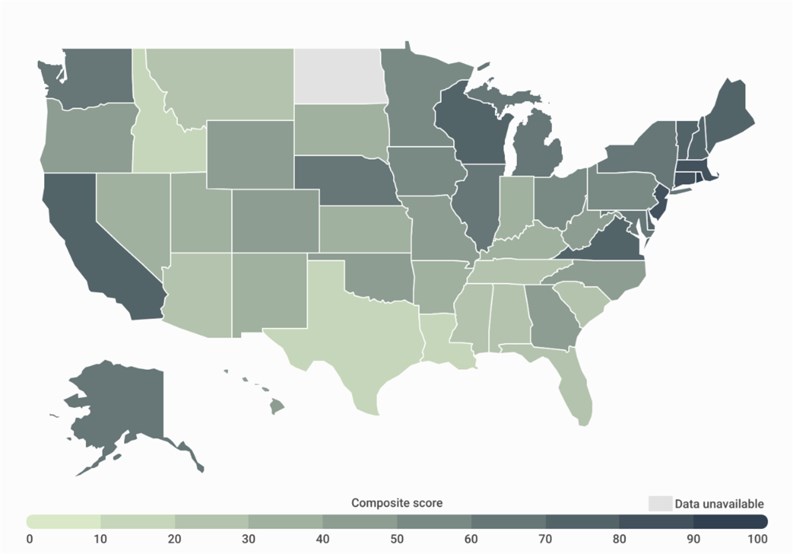
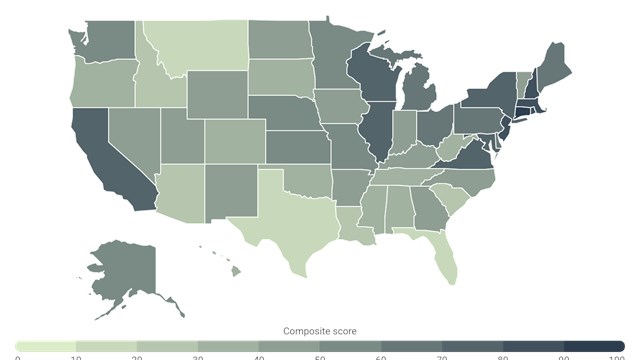
To determine the locations with the liveliest real estate markets in 2024, researchers created a composite score equally weighting the following metrics:

  • One-year change in median sale price (Dec 2022–Dec 2023)
  • Share of homes that sold above asking (2023)
  • Median number of days on the market (2023)
  • Average sale-to-list percentage (2023)
  • Share of listings with price drops (2023)

When it comes to the New York City metro, other key takeaways from the report include that:

  • As of December 2023, the median home sale price in NYC was $800,000, representing an increase of 0.6% from one year prior.
  • 10.6% of NYC homes sold over their asking price last year, after spending a median 79.9 days on the market.
The report’s analysis included more than 600 U.S. cities, and the 49 states with sufficient data. You can read the complete results and methodology here.

Related Articles

Report: Only 17.0% of NYC Homes Are Single-Family

Report: Only 17.0% of NYC Homes Are Single-Family

Big Apple's Share Lowest in U.S.

Real estate developer and managing property investment concept. Selective focus wooden houses with question mark on wood table

Another Year of Modest Growth for U.S. Condos & HOAs in 2024

CAI Housing Experts Weigh In

hard to buy a house. rising property, real estate market

The Growing Housing Crisis

'No Easy Answers,' Says NHC Head

line graph showing rising housing costs by median rent and median purchase price

Only 19.6% of NY Metro Gen Z Adults Live on Their Own

Higher Costs, Lower Wages Lead to Delayed 'Life Milestones'

Line graph showing decreasing supply of US homes by year from 2012 to 2022

Study Shows NYC Has Highest Home Inventory in US

Time on Market Also x3 the National Average

Arrow showing oscillation, fluctuation or stagnation. Economic crisis, persistence and progress concept. Flat design. EPS 8 vector illustration, no transparency, no gradients

New York Co-op & Condo Sales in Gridlock - for Now

High Interest Rates the Main Culprit