
According to a new report by construction industry advisory firm Construction Coverage, after stiff competition and fast-rising prices—approximately 40% in a two-year span—the residential housing market began cooling in the second half of 2022 and beginning of 2023. Those high prices, inflation in other sectors, and declines in the stock market have made it more difficult for buyers to build up the savings needed to buy a home, and rising interest rates have increased borrowing costs.
These combined factors have slowed the market considerably, resulting in decelerated price growth and fewer home sales. That said, some markets have been more resilient, despite the overall decline. To identify locations where the housing market stayed hot in 2022, researchers developed a composite score using key indicators from Redfin, then ranked cities accordingly.
NYC Ranked 4th Lowest
After home prices rose approximately 40% in just two years, many buyers have found themselves priced out of the game. Inflation in other sectors and declines in the stock market have made it more difficult to build up the savings needed to buy a home. On top of this, rising interest rates have increased borrowing costs, which in turn reduced the budget for many buyers—especially first-time buyers without existing equity or the financial capacity for a large down payment. These factors have slowed the market considerably.
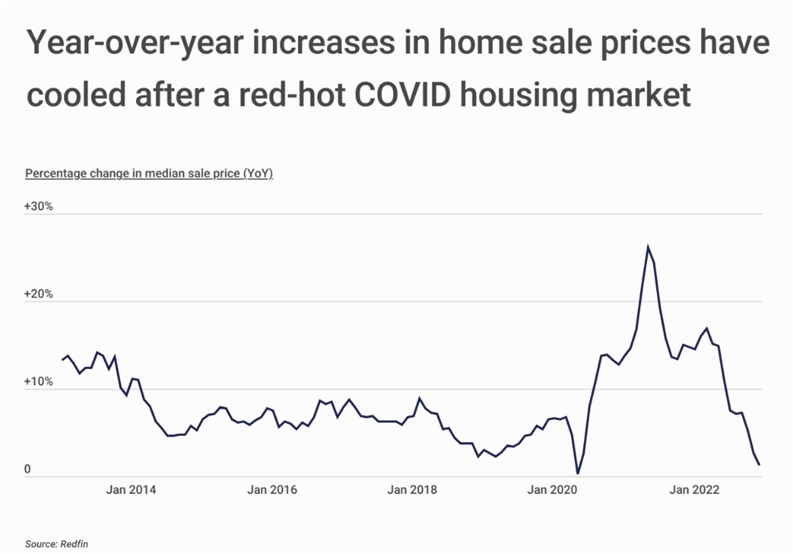
One of the most obvious effects has been on home sale prices. Prices skyrocketed during the COVID pandemic while interest rates were low, households savings and investment returns were high, and more people were spending time at home. According to data from Redfin, the year-over-year rate of growth reached a peak of 26.1% in May 2021, and the market continued to see double-digit percentage growth until the middle of 2022. By contrast, by the end of 2022 home prices were just 1.3% higher than they were the year before.
The volume of home sales has also decelerated dramatically in recent months. Stay-at-home orders in the early months of the COVID-19 pandemic brought the market to a halt, with the number of home sales declining by more than a third from the spring of 2019 to the spring of 2020. But as the market picked up, the year-over-year change in the number of homes being sold reached a record high of 49.1% in May 2021. But these figures have quickly fallen off as well. At the end of 2022, the volume of home sales was 36.7% lower than the year prior.
Density, Regulation Pose Building Challenges
Despite the cooling of the real estate market, some regions continued to see relatively high levels of activity in 2022. Prices have been leveling out in many parts of the U.S., but certain states have continued to have higher numbers of homes selling above list price. Most of the states where that has been the case are in the Northeast, led by Massachusetts at 59.4%. One factor likely contributing to increasing prices in these states is the difficulty of adding housing stock. States like Massachusetts, New Jersey, and California have multiple densely populated cities where sheer lack of land makes it harder to build, and/or regulatory regimes that make it difficult to add new homes. In the central and southern parts of the U.S., fewer homes are continuing to sell above their asking price. At the local level as well, certain markets have proven to be resilient against the overall decline in housing demand.
To identify locations where the housing market stayed hot in 2022, Construction Coverage developed a composite score using key indicators from Redfin about different local markets. The composite is based on the following factors:
- One-year change in median sale price (higher values ranked higher)
- Share of homes that sold above asking price (higher values ranked higher)
- Median number of days on the market (lower values ranked higher)
- Average sale-to-list percentage (higher values ranked higher)
- Share of listings with price drops (lower values ranked higher)
Here is a summary of the data for New York, NY:
- Composite score: 21.6
- Median sale price: $814,827
- 1-year change in median sale price: -0.6%
- Share of homes that sold above asking: 13.2%
- Median number of days on the market: 60.9
- Average sale-to-list percentage: 98.4%
- Share of listings with price drops: 24.1%
For reference, here are the statistics for the entire United States:
- Composite score: N/A
- Median sale price: $409,056
- 1-year change in median sale price: +1.3%
- Share of homes that sold above asking: 44.2%
- Median number of days on the market: 25.8
- Average sale-to-list percentage: 100.9%
- Share of listings with price drops: 14.3%
For more information, a detailed methodology, and complete results, you can find the original report on Construction Coverage’s website.


Leave a Comment