Home equity is one of the biggest contributors to household wealth. According to a Census Bureau report, two assets—home equity and retirement accounts—account for 63 percent of American households’ net worth. Yet, prior to the COVID-19 pandemic, only 65 percent of households owned their homes; among minority households, this share was much lower: just 47 percent.
The gap in homeownership between white households and minority households has long persisted. Despite this gap, homeownership rates across ethnic groups have largely trended together with the ups and downs of the economy. In recent years though, the Hispanic homeownership rate has grown faster than that of any other group. Experts attribute this increase to gains in income and education, and a large millennial population entering homeownership age.
Despite some improvement, low rates of homeownership among minority households is both a result of and a cause of continued wealth inequality, which has only grown worse over the past several decades. Now, spurred on by record-low mortgage rates and the desire for more space, the real estate market is booming in many cities across the country. However, the COVID-19 pandemic has had a disproportionate impact on lower-income households, and new research suggests that the pandemic is further widening existing housing disparities.
In large part due to higher homeownership rates, White families have much higher net worth than Hispanic, Black, and other or multiple race families. Data from the Federal Reserve Board shows that the median net worth of White families was $188,200 in 2019, while the median net worth of Hispanic and Black families was just a fraction of this, at $36,100 and $24,100, respectively. Minority families of other races were better off financially than Blacks or Hispanics, but still lagged behind White families by a wide margin
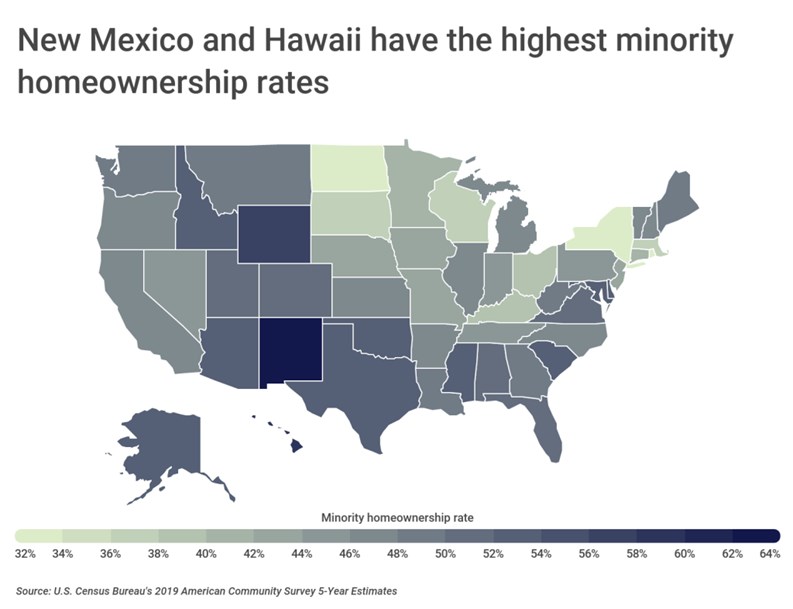
In some parts of the U.S. with large non-White populations, minority homeownership is more prevalent. The Southwest has a large Hispanic population and also high minority homeownership rates. Among all states, New Mexico and Hawaii, both of which have majority minority populations, have the highest rates of minority homeownership. The minority homeownership rate is 63.7 percent in New Mexico and 59.7 percent in Hawaii. On the other hand—and despite having a large minority population—New York has the second lowest minority homeownership rate in the U.S. at just 33.1 percent. With a minority homeownership rate of 31.6 percent, North Dakota has the lowest rate in the country.
To determine the cities with the highest and lowest minority homeownership, researchers at Construction Coverage analyzed the latest housing data from the U.S. Census Bureau. Cities were ranked according to their minority homeownership rate. Researchers also calculated the homeownership rates for Black; Hispanic; Asian, Native Hawaiian, and Pacific Islander; and White households, as well as the minority population share.
To improve relevance, only cities with at least 100,000 people were included in the analysis. Additionally, cities were grouped into the following cohorts based on population size:
Midsize cities: 150,000–349,999
Large cities: 350,000 or more
The analysis found that in NYC, 68.1% of the total population identifies as part of the minority population. Among minority households, only 26.5% own their homes. Out of all large U.S. cities, NYC has the 3rd lowest minority homeownership rate. Here is a summary of the data for New York, NY:
Black homeownership rate: 26.8%
Hispanic homeownership rate: 16.6%
Asian, Native Hawaiian, & Pacific Islander homeownership rate: 42.5%
White homeownership rate: 42.7%
Minority population share: 68.1%
For reference, here are the statistics for the entire United States:
Black homeownership rate: 41.8%
Hispanic homeownership rate: 47.3%
Asian, Native Hawaiian, & Pacific Islander homeownership rate: 59.1%
White homeownership rate: 71.9%
Minority population share: 40.0%
For more information, a detailed methodology, and complete results, you can find the original report on Construction Coverage’s website: https://constructioncoverage.com/research/cities-with-the-highest-minority-homeownership-rates-2021






Leave a Comment