
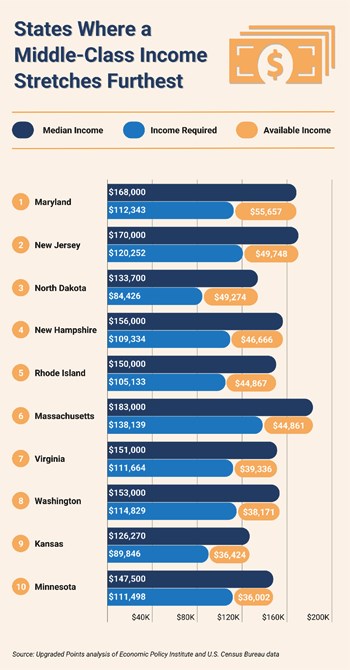
As the cost of housing, groceries, and childcare continues to rise, middle-class families across the U.S. are feeling the squeeze. But in some cities, higher wages outpace expenses—giving families more financial breathing room.
A new analysis from consulting firm Upgraded Points ranks the best and worst places for middle-class financial stability, examining how much income is left after covering essentials like housing, food, childcare, and healthcare for a typical two-adult, two-child household.
Key Takeaways for the NYC Metro
At the bottom of the rankings, there’s a striking mix of states with both extremely high and relatively low living costs. On the high-cost side, California and New York illustrate how even substantial incomes can be overwhelmed by exorbitant expenses. For example, New York’s median income of $144,000 is eroded by steep housing costs and the highest childcare expenses and taxes in the country, leaving families with just $7,141 in available income after necessities.
On the other hand, lower-cost states like West Virginia, Wyoming, and New Mexico rank poorly due to incomes that lag behind even modest living expenses. In West Virginia, for example, the median family income of $101,000 is not enough to meet the $102,474 required to cover necessities, making it the only state where families face a deficit. Similarly, Wyoming residents face below-average incomes paired with above-average costs in certain categories that outpace what middle-class families can afford.
Here is a summary of the data for the NYC/NJ Metro:
- Available income after necessities: $23,609
- Median family income: $165,000
- Income required to cover necessities: $141,391
- Housing costs: $26,172
- Food costs: $13,986
- Childcare costs: $30,551
- Transportation costs: $13,849
- Healthcare costs: $18,928
- Other necessities costs: $14,218
- Income taxes: $23,689
For reference, here are the statistics for the entire United States:
- Available income after necessities: $21,939
- Median family income: $130,000
- Income required to cover necessities: $108,061
- Housing costs: $17,221
- Food costs: $12,456
- Childcare costs: $19,896
- Transportation costs: $17,587
- Healthcare costs: $16,254
- Other necessities costs: $10,507
- Income taxes: $14,137
This juxtaposition highlights the challenges middle-class families face at both ends of the cost spectrum. In high-cost states, strong economies and higher incomes aren’t always enough to make up for rising prices, while in lower-cost states, incomes often fail to provide the financial stability families need to get ahead.
National Overview
Across the U.S., the average middle-class family has $21,939 in available income after covering essential expenses. Housing, childcare, and healthcare account for the largest shares of the $108,061 in income required to cover basic necessities.
Cities like San Jose; Washington, D.C.; and Seattle top the list of large metros due to exceptionally high median family incomes that outpace their elevated costs of living. Conversely, Los Angeles ranks near the bottom due to a combination of high costs and lower-than-expected incomes for middle-class families, leaving little leftover income after necessities.
Counterintuitive Findings
Some high-cost cities rank well because their median incomes are proportionally higher, allowing families to retain more after necessities. Meanwhile, some lower-cost cities struggle due to incomes that fail to keep pace with even modest expenses, highlighting disparities across different economic regions.
The full report covers 230 U.S. metros and all 50 states, with a detailed breakdown of incomes and expenses.


Leave a Comment