While homelessness rates in the U.S. fell between 2007 and 2019, the problem has started to increase again. According to the U.S. Department of Housing and Urban Development, in 2017, the U.S. began seeing a rise in homelessness year over year for the first time since the most devastating part of the housing crisis in 2010. On any given night during the cold month of January, over 568,000 people in this country experience the fear and discomfort of homelessness.
Homelessness also has a disproportionate effect across the nation. California, for example, saw a substantial 16% increase in 2019 over 2018. Cities also seem to struggle the most with a lack of housing for the most vulnerable. More than half of all homeless people (53%) are in the 50 largest U.S. cities.
While these numbers are alarming, they likely understate the true size of the problem. The very nature of the stigma around homelessness makes people less likely to report how insecure their housing is.
Making a Bad Situation Worse
COVID-19 has made the past year especially challenging for low-income workers. The alarming rise in joblessness, combined with soaring housing and rental prices, means that many people are suddenly unable to pay for their living situations. As a result, 2020 could see the biggest rise yet as lower-income individuals and families grapple with joblessness in the face of the pandemic.
Those who were already at risk for homelessness find themselves in a difficult position - and the potential dramatic rise in homelessness during 2020 could make already complicated housing policies even worse.
Different Approaches...Uneven Results
The most modern approaches to homelessness were developed in the early 1980s. Because most housing experts thought that the homelessness created by the 1980–1983 recession would resolve on its own, they created an emergency short-term solution. However, homelessness only continued to grow during the 80s and 90s.
In response to this rise, the U.S. Department of Housing and Urban Development (HUD) enacted a policy referred to as Housing First. The goal of Housing First was to make homelessness brief and non-recurring by getting the homeless out of in-between situations - such as a shelter, for example - and immediately into a permanent home. The Housing First policy started with George W. Bush and continued to grow with each successive president. The model built upon the assumption that permanent housing was the best way to end homelessness. It required that accomodation be provided immediately without any preconditions, such as sobriety. Proponents of the policy state that people can start to work on the issues that led to their homelessness, - such as mental illness or addiction - much more effectively after they secure housing.
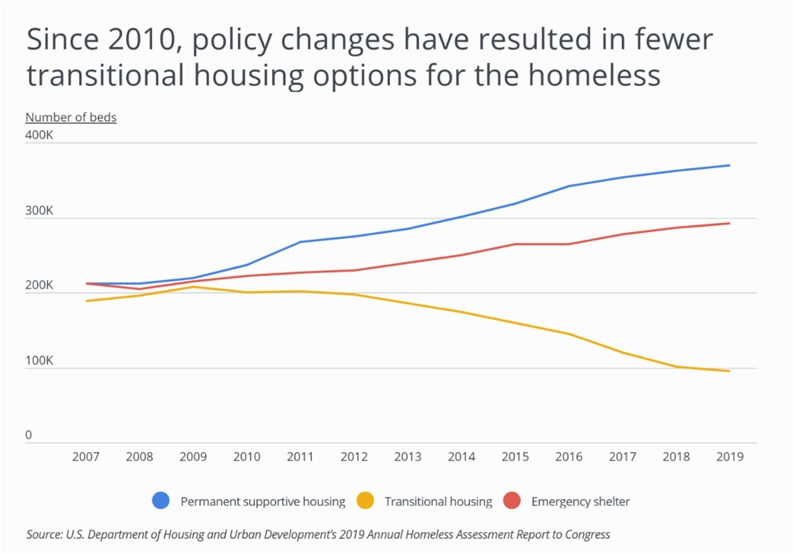
Housing First proponents also contend that the model is more cost-effective and permanent than others, some critics question its effectiveness. The main issue that many communities run into with Housing First is a lack of transitional housing. Critics of Housing First policy state that transitional housing is a critical way to make sure individuals and families stay off the street until more permanent housing can be found. In 2019, transitional housing provided less than 100,000 beds for those who needed a place to stay the night - and funding for transitional housing continues to nosedive. In 2018, only 3% of HUD’s Homeless Assistance Grant Program went to transitional housing, down from 35% in 2005.
Most of the recent increase is the large number of individuals experiencing homelessness. Between 2018 and 2019, homelessness in families decreased by 5%. However, cities are seeing a dramatic rise in individual homelessness. California, for example, saw individual homelessness grow 21% in the past year.
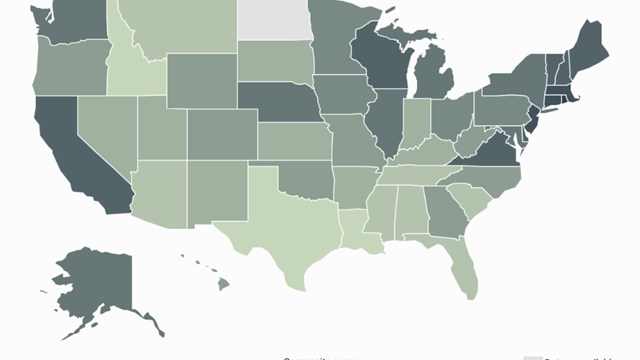
To identify the states with the largest homeless populations, researchers at Porch analyzed data from the U.S. Department of Housing and Urban Development’s 2019 Annual Homeless Assessment Report to Congress. Using these statistics, they calculated the total homeless population per 10,000 residents. The researchers also incorporated data on the homeless population in families with children, those without shelter, and those who are considered chronically homeless.
The analysis found that in New York State, there are 47.3 homeless people for every 10,000 residents. In total, 4.4% of the homeless New York State population is living unsheltered. Among all U.S. states, New York has the highest rate of homelessness. Here is a summary of the data for New York State:
Total homeless population: 92,091
Homeless individuals (not in families with children): 42,113
Homeless population in families with children: 49,978
Percentage of homeless population living unsheltered: 4.4%
Percentage of homeless population chronically homeless: 7.8%
For reference, here are the statistics for the entire United States:
Total homeless population: 567,715
Homeless individuals (not in families with children): 396,045
Homeless population in families with children: 171,670
Percentage of homeless population living unsheltered: 37.2%
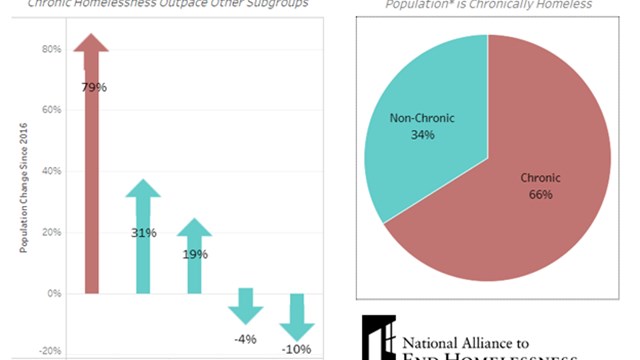
Percentage of homeless population chronically homeless: 18.6%
For more information, a detailed methodology, and complete results, you can find the original report on Porch’s website: https://porch.com/advice/states-with-largest-homeless-populations





Leave a Comment