Since the onset of COVID-19, millions of Amercians have been spending significantly more time at home. According to data from the Census Bureau, the typical American family spends about $2,850 per year - or about 22 percent of total housing costs - on their utility bills. With working from home on the rise due to the COVID-19 pandemic, Americans are beginning to experience one of the hidden costs of working remotely: increased utility spending. Indeed, a new report looking at the cities with the highest utility bills in the United States has found that while the pandemic has reduced commercial and industrial energy usage, residential utility bills are rising. Data from the U.S. Energy Information Administration (EIA) shows that industrial and commercial electricity usage have both declined due to shutdowns, stay-at-home orders, and increased remote working in the wake of the pandemic. In contrast, residential electricity usage in the last few months is higher than the average for the last five years. Not only has working from home led to increased electricity, internet, and phone usage for residential customers, but many Americans are using more energy for things like cooking and running the dishwasher more frequently as well.
Researchers compiling the usage report on behalf of air purification distributor Filterbuy ranked metropolitan areas according to their respective median monthly utility costs. For the New York City metropolitan area, the median utility bill is $300 per month, factoring in electricity, water, and gas costs, compared to the median monthly cost of utilities at the national level, which is $238. Out of all large metropolitan areas in the United States, New York City reports the 2nd highest utility bills; only the Boston metro is higher, with an annual median average of $309.
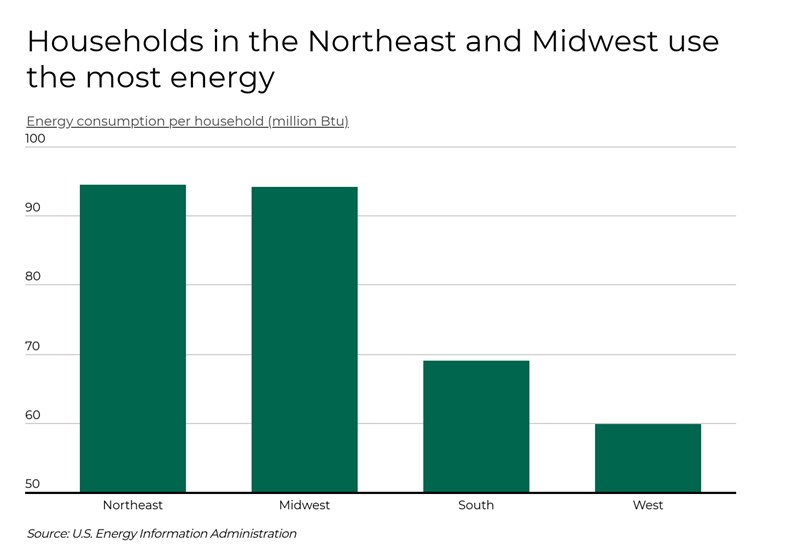
Energy usage depends greatly on climate. Households in colder climates tend to use a lot of energy in the winter for heating, while people in warmer climates see their highest energy usage during the summer months. According to data from the EIA, households in the Northeast and Midwest use the most energy on average. Households in the more temperate West region use the least.
Spending on utilities depends not only on climate but also on energy costs, which vary geographically. With total utility spending (including electric, gas, other heating fuels, water, and sewer) in excess of $280 per month for the typical household, residents in Connecticut, Massachusetts, Alaska, and Rhode Island spend the most on utilities. Total utility spending is lowest in New Mexico, Montana, and Idaho, where median utility costs are less than $200 per month.
To find the metropolitan areas that spend the most on utilities, researchers at Filterbuy analyzed the latest data from the U.S. Census Bureau on owner-occupied housing units. The researchers ranked metro areas according to their respective median monthly utility costs, including electricity, gas, other heating fuels, water, and sewer. The researchers also calculated median monthly utility costs as a percentage of total housing costs. A bulleted summary of the analysis with data for the New York-Newark-Jersey City, NY-NJ-PA metro area is below; the original report, including data on more than 250 metros in all 50 states can be found here: https://filterbuy.com/resources/cities-with-most-expensive-utilities/
New York-Newark-Jersey City, NY-NJ-PA
Median total utility costs: $300Median utility costs as a percentage of total housing costs: 14.9%
Median electric costs: $150
Median gas costs: $100
Median other fuel costs (oil, coal, kerosene, wood, etc.): $150
Median water and sewer costs: $46


Leave a Comment